Author: Giovanni Marano

The Misleading Power of Correlation

Have you ever heard a phrase like this? “A new Nicholas Cage movie just came out, so the number of people who drown in swimming pools is about to rise.” Probably not, and if you did hear it from a friend… well, you might have asked yourself a few questions about their mental state. However, looking at the graph below – based on real data – your friend might actually be right.

grafico-correlazione

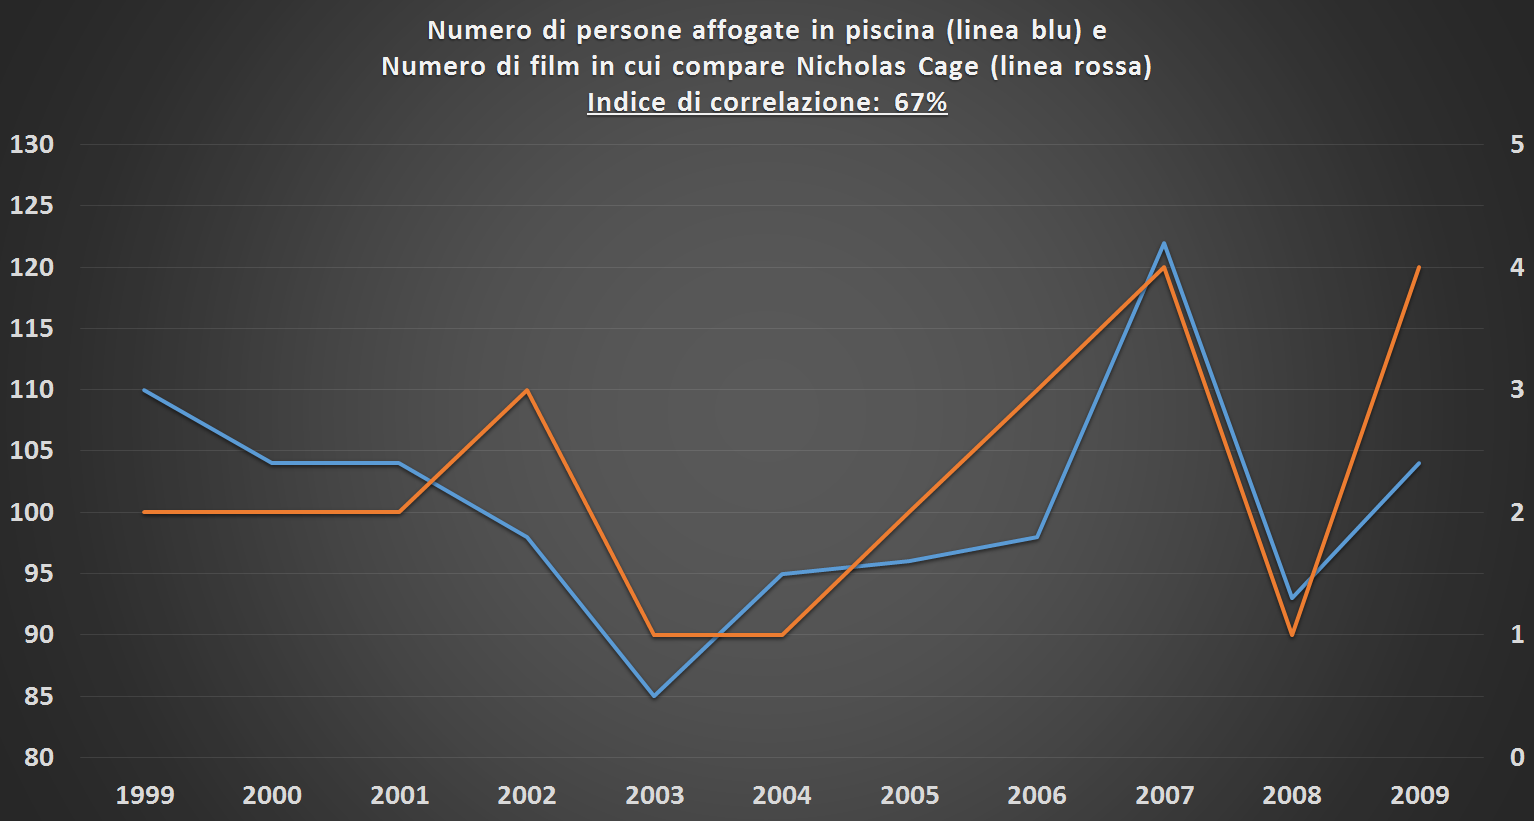
What does this graph tell us? Let’s start with that number highlighted in the title, known as the correlation index. The linear correlation index is a measure that describes how much one variable changes when another changes. An index of 100% means that as one variable increases, the other increases in exact proportion. The index for the two variables shown in the graph (the number of people who drown in swimming pools and the number of movies featuring Nicholas Cage) is 67%, a rather high value. This means that the two variables have moved almost in sync over time, and we can say that there is a strong correlation between them.

So, where’s the mistake? The mistake in the initial statement lies in assuming a cause-and-effect relationship (causality) between the two variables. The old adage that every statistics student has likely read at least once in their life states: “Correlation does not imply causality.” Or, in other words, correlation is a necessary but not sufficient condition for causality.

It seems like a trivial statement, but in reality, it’s not as obvious as we might think. In the example above, it’s clear that only a madman would imagine a cause-and-effect connection between the two variables, but when applied to more realistic cases, we can say that all correlation measures in any statistical study never assume a causal hypothesis. Every correlation index provides a mere numerical result, and it’s up to us to establish a cause-and-effect relationship based on the logic of the facts or certain assumptions.

As incredible as it may sound, there are many variables that are almost inextricably correlated (correlation coefficients above 90%) but have no logical connection. Here are some real examples from the United States in recent years:

  • Per capita mozzarella consumption and PhDs in civil engineering (correlation 95%)
  • Per capita margarine consumption and divorce rate in Maine (correlation 99%)
  • Barrels of crude oil imported to the USA from Norway and drivers dying in car crashes with trains (correlation 95%)

In all these cases, the two variables are so completely disconnected that the high correlation is undoubtedly due to the irony of chance, and we can confidently rule out any cause-and-effect relationship.

But what about other cases? In other cases, we face situations where seemingly inexplicable correlations are actually phenomena of indirect correlations, often difficult to interpret. Consider the following pairs of variables:

  • Ice cream consumption and shark attacks
  • Air traffic density and spending on cultural activities
  • Number of bars in a city and the number of children enrolled in school

Obviously, these are not direct correlations, since in all these cases, the first variable (A) and the second variable (B) are not directly related to each other. But upon closer inspection, we realize that the two variables are not entirely unrelated, but are both linked to a third, latent or unmeasured variable (variable C), which causes a phenomenon called “spurious correlation.” Any ideas? Think of these variables:

  • Average temperature (both phenomena are more frequent in summer)
  • Per capita income (both phenomena are more likely in cities with a higher average income)
  • Population size (both phenomena are related to the number of people in the city)

With these “hidden” variables, we can solve the mystery of the inexplicable correlations: even though A and B aren’t directly connected, variable A is linked to C (the latent variable), and variable C is linked to B.

Obviously, depending on the complexity of the study, it can be very difficult to understand whether a high correlation index is due to a cause-and-effect phenomenon, a spurious correlation, or neither. The key point is the need to carefully interpret every correlation index to avoid drawing totally wrong conclusions.

So, what’s the takeaway from these examples? I’d say it’s a kind of demystification of “numbercracy,” the idea that numbers have the power to explain reality uncritically. Numbers and statistical indices are useful, indeed incredibly useful, for understanding real-world phenomena, but they always require interpretation and critical judgment before being accepted as dogma and conveying a potentially incorrect meaning.

But just to be safe, the next time a Nicholas Cage movie comes out… stay away from the pools! 🙂

The useleness of absolute numbers

A few days ago, I was reading an article about accidents involving cyclists. Being an avid cyclist and dealing with data and numbers of all kinds every day, I immediately noticed this sentence: “The regions most affected by accidents are those where bicycles are a real tradition: Lombardy, Veneto, Emilia Romagna, and Tuscany. Incidents tend to occur on Saturdays and Sundays, between 10 AM and 12 PM, during the months of May to October, with a peak in August.”

What seems odd to you?

After reflecting for a moment, it’s clear that the regions, days, and times when accidents are most frequent are simply those when cyclists are most frequently on the road. This is a type of error or oversight that’s fairly common among journalists, who, being less familiar with numbers, often report data without critically analyzing it.

Saying that accidents happen more frequently on Saturdays and Sundays doesn’t provide any useful information, because those are the two days when cyclists are on the roads the most, and thus are also the days with the highest risk of accidents (the same logic applies to the most popular months and times of day). In this case, the raw data doesn’t make any sense unless it’s somehow “cleaned up.”

What needs to be done in such cases is to have a “benchmark” to compare the results. In the case of our article, a simple benchmark could be the ratio between the number of accidents and the number of cyclists on the road that day. This means that, instead of looking at the absolute number of accidents, we look at the relative number. By doing this, we give each day of the week the same “probability” of being the most dangerous day, removing the natural advantage that days like Saturday or Sunday have due to the higher number of cyclists.

Let’s take a look at the table below (note that the numbers are fictional):

DayNumber of accidentsNumber of cyclistsRatio
Mon101.0001,0%
Tue152.0000,8%
Wed101.5000,7%
Thu151.0001,5%
Fri203.0000,7%
Sat408.0000,5%
Sun6010.0000,6%

If we consider the absolute number of accidents, Sunday is the most dangerous day with 60 accidents. However, if we use the correct benchmark, dividing the number of accidents by the number of cyclists on the road, the most dangerous day in relative terms becomes Thursday, with a ratio of 1.5%.

A similar example of this concept is found in marketing: the effectiveness of an advertising campaign targeted at a certain group of people is evaluated not only by looking at the absolute value, but by comparing it to the results of a “control group” – a group of customers who are not exposed to the campaign. Only by “relativizing” the absolute results can we determine whether the campaign was effective or not.

So, when you come across statistics and conclusions like this, pay attention to the data and ask yourself whether they’ve been properly analyzed or not, because otherwise, they might not make any sense.

And anyway, to stay safe and avoid articles like this, when you go out cycling, be careful around cars!

Don’t trust the latecomers

When creating a blog, one of the first things to do is to come up with a name. Before choosing datastory.it, we considered several options, but some of them were already taken. On one of these sites, we came across a phrase that made our few remaining hairs stand on end. It went something like this:
“This site contains an algorithm capable of generating Lotto numbers that are more likely to be drawn than others.”

Such words sound to a statistician like a blasphemy sounds to a priest. Have you ever heard of “hot numbers” or “overdue numbers”? Surely you have. Well, we can guarantee you that these numbers are meaningless, and there is no algorithm capable of generating numbers more likely to be drawn than others. Let’s explore why.

The Lotto, or any similar game, consists of 90 balls, each with an equal probability of being drawn: 1/90, or about 1.1%. So far, so good. But what if you were told that after 100 draws, all the numbers from 1 to 90 had been drawn except one, say 27? Would it change your strategy? Would you bet on 27 because it’s overdue? The answer is an emphatic no because the probability remains the same for all numbers. There are at least two reasons for this.

Intuition – The balls in the drum are not influenced by previous draws. There is no reason why a ball should become larger, smaller, hotter, or colder depending on how many times it has been drawn (or not drawn) in the past. Each ball’s probability is always equal to that of the others, even if it hasn’t been drawn for a thousand consecutive rounds.

Probability Theory – This phenomenon can be described by a random variable following a geometric distribution, which measures the probability that the first success occurs after a certain number of trials (each with equal probability—in this case, 1/90). It can be shown that the overall probability remains exactly the same for both the n-th draw and the m-th draw, where m is greater than n. Thus, we arrive at the same conclusion: the drum has no memory.

The “Hot Numbers” Misconception – Where do these so-called Lotto experts go wrong with their theories on overdue numbers? They often invoke the nebulous dogma known as the Law of Large Numbers. While this is a complex topic that will be discussed separately on this blog, the law essentially states that as the number of trials approaches infinity, the frequency of each outcome converges to its theoretical probability—in this case, 1/90. For example, after 90 million draws, each number will have been drawn approximately 1 million times.

However, this law does not imply that after a certain number of draws, the probability of a number increases because it has been drawn less often than others. The reasoning of those who promote overdue numbers would only hold true if there were a finite number of draws. In such a case, if by the second-to-last draw one number had been drawn less frequently than the others, it would logically be the one drawn in the final round. But the Law of Large Numbers refers to an infinite number of trials, so with every draw, it’s as if everything resets. From that point on, the expected frequency of every number remains 1/90 for all future draws.

What we’ve discussed so far doesn’t just apply to the Lotto but extends to all situations involving independent repetitions of the same event, such as rolling dice or betting on numbers and colors in roulette. For example, if after 10 spins of a roulette wheel, red has come up every time, what do you expect on the next spin? If you think black is more likely, you’re deeply mistaken: the probability doesn’t change—it remains 50-50 for red and black (ignoring the green zero).

So, if you decide to play the Lotto or any similar game, don’t trust anyone urging you to bet on overdue numbers. Doing so would be no different than choosing numbers based on your birthdate or the last digits of your license plate.

© 2025 Datastory.it

Theme by Anders NorenUp ↑